There are moments when a single scroll reveals what an entire season will want. For many designers and brands, that feeling is a call to act—faster, smarter, and with clearer intent.
The United States market moves quickly; viral cycles and diverse customers compress time-to-market. McKinsey and Heuritech show how powerful signals in media and images translate into measurable market impact. This guide frames trend forecasting as a practical process that moves teams from hunches to data-backed insights.
Readers will find a clear path: define audiences, extract attributes from pictures, train models, and tie results to assortment and inventory choices. Real examples—Zalando with Muze, Ralph Lauren, Warby Parker, Amazon Go—illustrate how tools and systems improve product-market fit.
By the end, leaders will understand which data and tools matter, how to avoid bias, and how to turn trend signals into action—so brands can deliver what customers actually want, faster.
Key Takeaways
- Trend forecasting turns social media signals into actionable insights for fashion teams.
- Brands compress time-to-market by combining computer vision, models, and clear process steps.
- Case studies (Heuritech, Muze, Ralph Lauren, Warby Parker, Amazon Go) show measurable gains.
- Focus on data quality, bias mitigation, and the right tools to improve accuracy.
- A practical roadmap helps designers and planners link trends to assortment and inventory decisions.
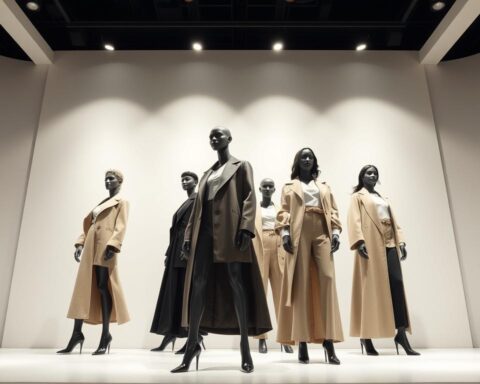
What Fashion-Trend Forecasting From Social Images Means Today
Where Paris and Milan once defined next season, real-time platforms now surface what people want today.
The center of gravity has shifted away from fashion shows and toward social media, where creators and everyday customers shape trends in public. Over 100 million images and 400 million stories are shared daily on Instagram alone, compressing time-to-market and amplifying short-lived motifs.
In the United States, speed matters: micro-trends can peak in two weeks, forcing brands to detect early signals and react with targeted capsules, restocks, and messaging.
Channels amplify behavior: more posts mean faster adoption cycles and greater volatility. Designers still guide aesthetic direction, but they now benefit from real-time data about what consumers actually wear and share.
How the shift works in practice
- The role of buyers and runway forecasters has become one voice among many across platforms.
- Customers and communities co-author trends that move from niche to mainstream.
- Brands that link market data to buying rhythms win—tiny sunglasses offer a clear example of rapid rise and fall.
For teams that want deeper methods, see trend forecasting research to align image signals with assortment and inventory decisions.
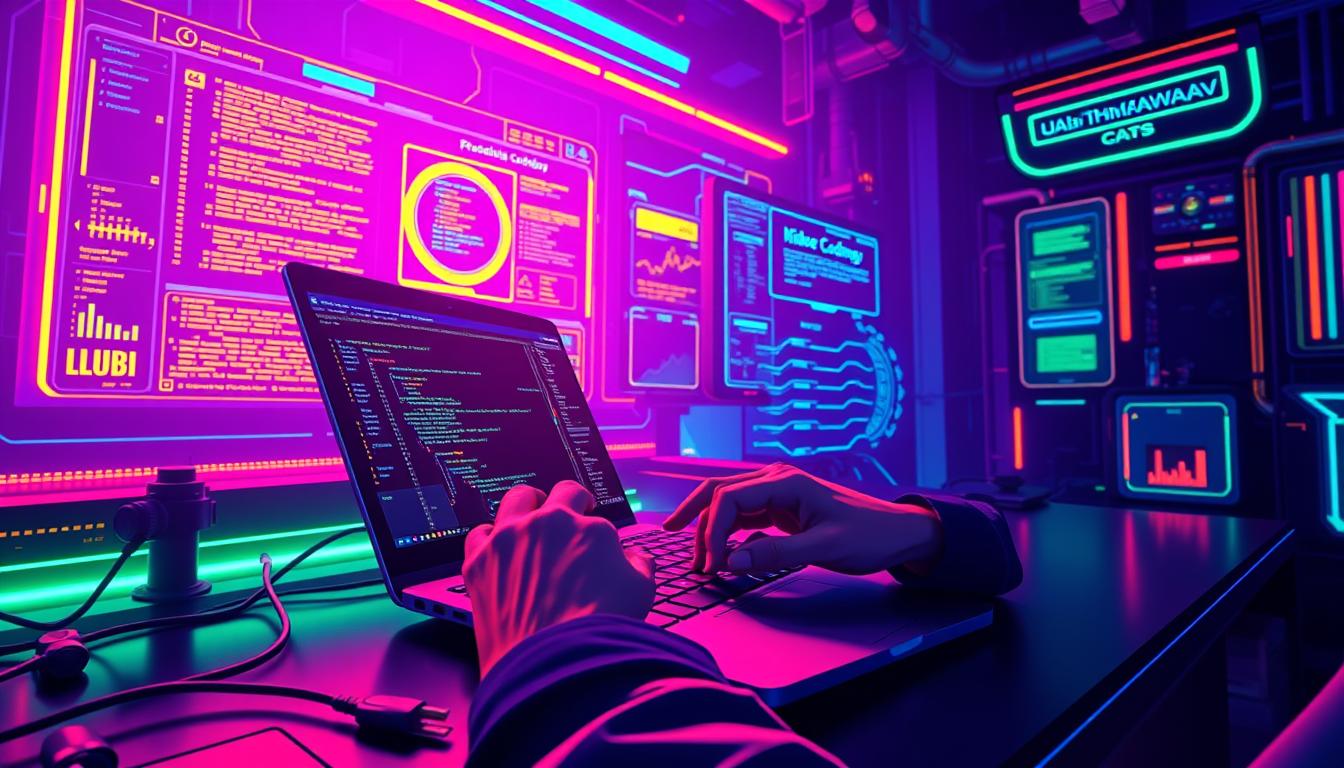
How AI Reads Social Media Images to Predict Fashion Trends
Computer vision turns a single photo into a map of style signals—colors, cuts, and context that reveal what shoppers will want next.
Multimodal computer vision decomposes each post into structured data: colors, fabrics, silhouettes, prints, textures, and scene context. Heuritech’s system, for example, detects over 2,000 attributes per image and scans 3M+ posts daily to quantify adoption patterns.
Mapping trend lifecycles
Early signals usually appear in edgy panels before moving to trendy groups and, finally, mainstream audiences. Machine learning tracks that spread and assigns momentum scores, so teams can see whether a trend is peaking or still climbing.
Blending historical and real-time data
Models merge historical data with live social streams to produce predictive analytics. Algorithms trained on labeled media images recognize fine-grained details—necklines, sleeve shapes, texture—that correlate with lift or decline.
- The process links visual adoption to time-series demand, not just mentions.
- Cross-platform and regional signals (GeoStyle, Brandwatch) strengthen trend prediction and reveal origin points.
- Designers and planners receive actionable analytics: what to highlight, when to scale, and when to phase out.
| Capability | Data Source | Business Benefit |
|---|---|---|
| Attribute extraction | 3M+ images/day, 2,000+ attributes | Quantifies visual features for demand models |
| Lifecycle mapping | Edgy → Trendy → Mainstream panels | Predicts adoption timing up to 24 months |
| Cross-channel signals | GeoStyle regional images; Brandwatch social posts | Pinpoints origins and diffusion paths |
AI Use Case – Fashion-Trend Forecasting from Social Images
A reliable workflow turns scattered platform signals into repeatable business actions for design and buying teams.
Core workflow: Heuritech’s four-step method structures the path from raw posts to market decisions. First, teams define representative audience panels—Edgy, Trendy, and Mainstream—so signals separate from noise. Next, computer vision scans millions of images to detect 2,000+ attributes per post. Then, deep-learning models and algorithms translate early signals into time-bound prediction up to 24 months. Finally, Market Insights dashboards deliver action on assortment, stock, merchandising, and marketing.
Where platforms fit
- Instagram and TikTok act as rapid-cycle arteries for micro-trends.
- Pinterest shows planning intent; YouTube supplies longer-form context.
- Weibo offers Asia market signals that inform global rollouts.
Teams operationalize this way weekly: review panel momentum, compare scenarios, update buys, and push insights into PLM or ERP via APIs. The workflow complements shows rather than replaces them—helping brands scale only designs that social validation supports. Continuous machine learning keeps forecasts aligned to new data so teams can decide what to amplify, test, or cut before costly commitments are made.
Inside the Workflow: From Audience Panels to Market Insights
When panels are defined well, trend signals stop being guesses and start guiding real product decisions.
Defining edgy, trendy, and mainstream panels
Panel design reduces bias: random sampling selects accounts that post regularly and show clear fashion interest. Edgy captures niche tastemakers; Trendy shows early adopters; Mainstream reflects mass preferences.
Detecting 2,000+ attributes and quantifying popularity
The image recognition engine tags colors, shapes, prints, textures, fabrics, and context across photos. Time-series analytics then measure volume and momentum so brands see when a trend peaks and how long it lasts.
Turning forecasts into assortment, merchandising, and pricing decisions
The Market Insights dashboard shows growth, seasonality, and audience breakdowns to inform assortment breadth, price ladders, and buy quantities. Designers and merchandisers use panel preferences to tailor line plans and manage cannibalization risk.
- Example outputs: audience fit, expected growth, launch windows.
- Models support scenario planning across regions and product categories.
- Data connects to buying calendars so weekly updates feed real checkpoints.
| Step | Output | Business Use |
|---|---|---|
| Panel sampling | Audience segments | Cleaner trend signals |
| Attribute detection | 2,000+ tags per photo | Demand planning |
| Dashboard | Growth & seasonality | Assortment & stock decisions |
Tools And Platforms Powering Image-Led Trend Prediction
Tool stacks that blend visual recognition, broad listening, and early-topic radar remove blind spots in trend signals.
Heuritech is the image-first engine: it analyzes 3M+ social media images daily, detects 2,000+ attributes, and produces early-signal forecasts up to 24 months. That depth turns visual posts into structured signals planners can trust.
Complementary platforms and what they add
- GeoStyle finds regional fashion trends by scanning millions of images—useful for localized assortments and regional marketing.
- Brandwatch brings scale: 1.4 trillion posts across 100M sources to add sentiment and voice-of-consumer context.
- Exploding Topics flags 70,000+ rising topics, giving design and content teams a 12–24 month radar on macro momentum.
Combined, these tools cover image recognition, broad listening, and early-topic detection. Algorithms and analytics differ by vendor; understanding each tool’s strength helps brands build a stack that fits category and market needs.
Practical tip: integrate outputs into BI dashboards, align taxonomies, and set refresh cadences so teams see trend velocity, regional lift, and risk at a glance.
Real-World Examples Brands Can Learn From
Concrete examples show how data-led workflows turn visual trends into sales-ready products.
Heuritech’s demand prediction translates image-detected attributes into actionable style and size curves. The system detects 2,000+ attributes and processes 3M+ images daily. That scale produces market overviews, quantifies styles, and splits audience preference for product planning.
For sneakers and everyday wear, this prediction shows which styles gain traction and which audiences prefer specific colorways. That insight helps brands size buys, plan drops, and limit overstock.

Zalando x Google Muze: generative design at scale
Muze generated 40,424 designs in a month by learning customer texture, color, and style preferences. The project shows how models and tools enable rapid creative exploration while keeping market fit central.
- Stronger bets: pairing image adoption with purchase signals improves creative and commercial decisions.
- Risk control: models flag attributes losing traction so teams can sunset styles early.
- Team alignment: images and data create a shared language across design, merchandising, and marketing.
| Example | Scale | Business Benefit |
|---|---|---|
| Heuritech demand prediction | 3M+ images/day; 2,000+ attributes | Right-sized buys; reduced overstock |
| Zalando x Muze | 40,424 designs in one month | Faster iteration; market-guided creativity |
| Combined approach | Image + purchase signals | Better trend prediction; smarter launches |
What Designers, Merchandisers, and Planners Gain
Clear market signals shorten the path between inspiration and a sellable product. Visual and behavioral insights let teams move from idea to proof quickly. That speed reduces guesswork and tightens alignment across design, buying, and merchandising.
Design acceleration: mood boards, colorways, and 3D prototypes
Generative tools co-create mood boards, sketches, and full outfit concepts that speed concepting without eroding creative control. Automated workflows produce tech packs, colorways, and 3D prototypes so designers iterate faster and test more designs in less time.
Assortment optimization and buyer persona targeting
Dashboards surface persona-level preferences and demand curves. Merchandisers then allocate styles, color splits, and sizes to segments that will convert, rather than treating the market as monolithic.
- Designers accelerate from idea to prototype, compressing cycles while preserving craft.
- Insights identify products with the highest upside, so teams prioritize samples and marketing.
- Tools help teams stay ahead—flagging rising attributes and securing materials early.
- Better clarity ties creative direction to commercial reality and reduces returns.
Linking Trend Forecasts to Supply Chain, Inventory, and Retail
Linking trend signals to operations turns vague popularity into concrete production plans.
Demand forecasting reduces overstock and aligns production. Predictive analytics blend historical data with live signals so planners right-size orders and phase deliveries. Brands integrate those outputs into MRP/ERP systems to match fabric commitments and factory capacity to sell-through windows.
Forecasts inform buy and production decisions: sequence colors, stagger runs, and set replenishment triggers. This lowers waste and shortens the path from concept to shelf. Predictive maintenance and quality control further reduce downtime and defects on the line.
Omnichannel and cashierless retail informed by live trend data
Omnichannel retailers route products to stores and DCs where customers show interest now. Inventory systems use tool-driven signals to prevent stockouts on fast movers and limit overstock on waning trends.
Example: cashierless concepts like Amazon Go show how computer vision and machine learning can simplify checkout and unify online/offline behavior.
- Store planograms adapt to local tastes based on localized trend detection.
- Retail media and merchandising update dynamically to spotlight trend-relevant products.
- Cross-functional decisions become faster—finance, merchandising, and operations rally around data-grounded scenarios.
| Function | Signal | Operational effect |
|---|---|---|
| Demand planning | Live trend momentum | Right-sized orders; phased deliveries |
| Inventory | Predictive analytics + historical data | Fewer stockouts; less overstock |
| Retail ops | Local trend detection | Targeted routing; dynamic planograms |
| Production | Capacity and quality signals | Staggered waves; reduced defects |
Sustainability Benefits From Better Trend Prediction
When trend signals are accurate, supply chains shrink excess and choose greener materials.
Accurate demand prediction reduces overproduction—the industry’s largest sustainability stressor. Predictive systems align buys to real consumer interest so fewer products sit unsold. That lowers waste, decreases markdowns, and reduces the carbon footprint of surplus goods.
Historical data paired with live signals helps procurement lock eco-preferred options without compromising availability. Systems that assess environmental impact and ethical sourcing recommend cost-effective, sustainable materials ahead of buying windows.
Practical gains across the value chain
- Predictive analytics guide safer buy quantities and smaller returns.
- Process improvements—cut optimization and right-first-time quality—reduce fabric waste.
- Supplier screening improves traceability and aligns with U.S. consumer expectations.
The way forward is proactive: embed data gates into calendars, vendor briefs, and design toolkits. When trend-aligned products sell through, brands can credibly report real sustainability wins to the market.
Risks, Ethics, and Best Practices
Responsible deployment starts with clear policies that protect people and respect context. Forecasting systems deliver powerful insights, but they carry risks that demand proactive governance.
Data privacy, bias mitigation, and transparent model governance
Clear privacy rules matter: establish consent, anonymization, and secure storage that align with U.S. regulations. Document what media is collected and why, and limit retention to the period needed for analysis.
Mitigate bias by diversifying training sets across demographics, regions, and style segments. Test algorithms and models regularly for skew and surface confidence scores so teams can weigh outputs.
Balancing machine learning with human creativity and cultural nuance
Designers remain central: human judgment reads cultural subtext and interprets behavior that models may miss. Treat model outputs as strategic guidance, not absolute truth.
- Set model governance: documentation, versioning, validation, and escalation paths.
- Encourage cross-functional reviews — designers, merchandisers, and legal should assess rights and use of content.
- Calibrate cadences: weekly checks for volatile trends; monthly reviews for foundational shifts.
The way forward is disciplined: train people to read dashboards critically, pair insights with store feedback, and make ethics a brand asset that builds trust.
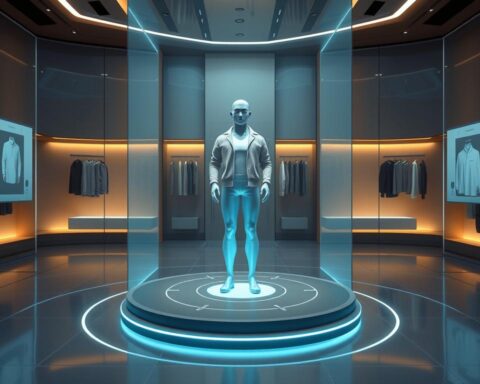
The Future Outlook: Hyper-Personalization and Real-Time Fashion
Forecasts point to a near future where collections respond to people, places, and moments in hours rather than seasons.
Hyper-personalization will arrive by 2025—brands will tailor capsules to micro-communities so designers can configure lines to local preferences and channel signals in near real time.
From micro-trend detection to localized, consumer-first collections
Next-gen dashboards already fuse social, sales, and sentiment so teams can adjust assortments mid-season. By 2027, preference signals will inform fabric and trim choices earlier, improving sampling speed and accuracy.
Practical effects: flash drops, localized edits, and targeted replenishment keep inventory lean while helping brands stay ahead of shifting tastes.
VR/AR visualization and next-gen dashboards for live decisioning
By 2028, VR/AR will move beyond try-on to co-design: customers preview styles, tweak colorways, and give immediate feedback that guides designers. Real-time dashboards will present unified data streams—media trends, POS, and sentiment—so teams act with confidence and speed.
| Timeline | Capability | Business Benefit |
|---|---|---|
| 2025 | Hyper-personalized micro-collections | Higher conversion; reduced markdowns |
| 2027 | Preference-driven sourcing | Faster sampling; greener material choices |
| 2028 | VR/AR co-design and live dashboards | Customer-led design; faster learning loops |
Example integrations include AR-guided store layouts and dynamic eCommerce visuals linked directly to live trend detection. Tools will orchestrate time-sensitive moves so designers focus on craft and narrative while automated systems handle routine decisions.
Brands seeking to move faster can explore practical reads on hyper-personalization and big-data strategies in this short brief: hyper-personalization studies.
Conclusion
Practical forecasting turns visual signals into steady business advantage.
Data that links what people wear to purchase intent unlocks faster decisions across design and supply. Heuritech shows how image-led methods scale, and McKinsey predicts a $150–$275B value pool for the fashion and luxury sector by 2028.
When brands align tools like GeoStyle, Brandwatch, and Exploding Topics with sales and sentiment, they gain clear, actionable insights. The result: smarter assortment, leaner inventory, and designs that match customer demand.
Responsible governance, weekly discipline, and human judgment keep creative control intact. The way forward is simple: blend human taste with precise data to build products that sell—sustainably and profitably.
FAQ
What does fashion-trend forecasting from social images mean today?
It means using media images and predictive analytics to spot emerging styles, colors, and silhouettes as they appear on platforms like Instagram, TikTok, Pinterest, and YouTube. Brands move beyond runway gatekeepers to monitor community signals, track viral micro-trends, and cut time-to-market.
How do computer vision models read social media images for trend signals?
Multimodal computer vision extracts attributes—colors, fabrics, prints, textures, silhouettes—and analyzes context such as location and event. Models detect thousands of attributes per image, then quantify popularity and velocity across audience panels to map trend lifecycles.
Which data sources and platforms provide the strongest early signals?
Visual-first platforms like Instagram and TikTok offer rapid, short-form cues; Pinterest and YouTube show discovery and intent; regional networks like Weibo reveal local trends. Combining these streams with historical datasets strengthens early-signal detection.
What is the core workflow for turning images into actionable forecasts?
The workflow covers data collection (panels and platforms), image recognition (attribute tagging), forecasting models (trend scoring and lifecycle mapping), and market insights that inform assortment, merchandising, and pricing decisions.
How do audience panels improve signal quality?
Panels—edgy, trendy, and mainstream—filter noise and surface clear signals. By segmenting contributors, teams can detect which cues are niche innovations versus scalable trends likely to reach mass markets.
How accurate are demand predictions derived from image-led forecasting?
Accuracy varies with data volume, model design, and horizon. Established providers report multi-month forecasts and attribute-level demand estimates that materially reduce uncertainty for product development and buying cycles.
How do forecasts translate into assortment and merchandising choices?
Forecasts inform SKU mix, colorways, and production quantities. Merchandisers use trend scores to prioritize best-fit attributes, align price tiers, and create targeted assortments for defined buyer personas.
Which commercial tools support image-led trend prediction?
Market tools include specialized visual-analytics platforms and trend services that aggregate billions of media images daily. Complementary sources like Brandwatch and Exploding Topics add context and signal validation across channels.
Can brands use these insights for faster design and prototyping?
Yes. Designers accelerate mood boards, colorways, and 3D prototypes by feeding attribute forecasts into creative workflows. Some teams pair demand signals with generative design to test concepts earlier in the cycle.
How do forecasts link to supply chain and inventory decisions?
Trend-informed demand forecasts enable tighter production planning, reduce overstock, and support agile replenishment. Retailers use live trend data to optimize omnichannel assortments and in-store assortments linked to localized demand.
What sustainability benefits arise from better trend prediction?
More accurate planning reduces waste by aligning production with real demand, enabling smaller, targeted runs and informed material choices that favor eco-friendly options without sacrificing commercial viability.
What ethical and privacy issues should teams address?
Teams must mitigate bias in training data, respect user privacy when collecting images, and maintain transparent model governance. Human review and cultural expertise are essential to avoid misinterpretation and harmful outcomes.
How do brands balance automated forecasts with human creativity?
Forecasts serve as inputs—guiding hypotheses and narrowing options—while designers and merchandisers apply cultural insight and aesthetic judgment. The best approach blends algorithmic signals with editorial direction.
What does the future hold for image-led trend prediction?
Expect hyper-personalized, localized collections informed by micro-trend detection, real-time dashboards for live decisioning, and immersive VR/AR tools that visualize forecasted assortments for stakeholders and consumers.