There are moments when a single shift in thinking feels like relief — when messy inventory, missed trends, and tight margins finally meet a clearer path. This introduction speaks to leaders who have stayed up late balancing spreadsheets and intuition. It recognizes the human weight behind strategic choices and offers a straightforward way forward.
The fashion industry is changing fast. McKinsey projects generative technologies could add up to $275 billion to operating profits by 2028. That figure explains why executives and brands must move from seasonal guesses to live signals that shape forecasting, inventory, and production.
This article maps practical steps: from forecasting and trend detection to factory execution and retail personalization. Readers will get clear insights on measurable benefits — lower overstock, faster turns, less waste — and a playbook to align creative teams, sourcing, and operations.
Key Takeaways
- Real-time signals turn trends into actionable forecasts for faster decisions.
- Evidence from Levi’s, Zara, and Hugo Boss shows production and quality gains.
- Generative gains (McKinsey $275B) make this a top leadership priority.
- Cross-functional alignment is essential: design, sourcing, factories, and retail.
- Outcomes include higher margins, lower waste, and improved market agility.
Why demand‑driven apparel operations matter now
Trend cycles now move in weeks, not quarters, forcing faster decisions across brands. Social platforms and creator culture amplify what styles and colors catch on. That shift makes consumer demand sharp, local, and unpredictable.
Rising consumer expectations and the fast‑fashion cycle
Consumers expect the right size, color, and channel—now. Omnichannel fulfillment and rapid refreshes raise the bar for inventory and fulfillment teams. Missed sizes or slow replenishment translate into lost sales and weaker brand loyalty.
The profitability upside: generative tech’s impact on fashion
Volatile trends mean financial risk: static plans produce overstock, markdowns, and stockouts when demand flips. Machine learning can ingest sales history, social imagery, search signals, and real‑time traffic to spot micro‑shifts ahead of traditional reporting.
- Sharper trend detection captures spikes in days, not seasons.
- Reduced financial drag from overstock and markdowns.
- Faster learning loops help brands stay ahead in a crowded market.
McKinsey estimates up to $275 billion in profit uplift for fashion, apparel, and luxury by 2028—a clear signal that more adaptive demand and production flows can deliver measurable gains. Leaders should treat demand alignment as a core capability: the right data, talent, and decision processes turn volatility into opportunity.
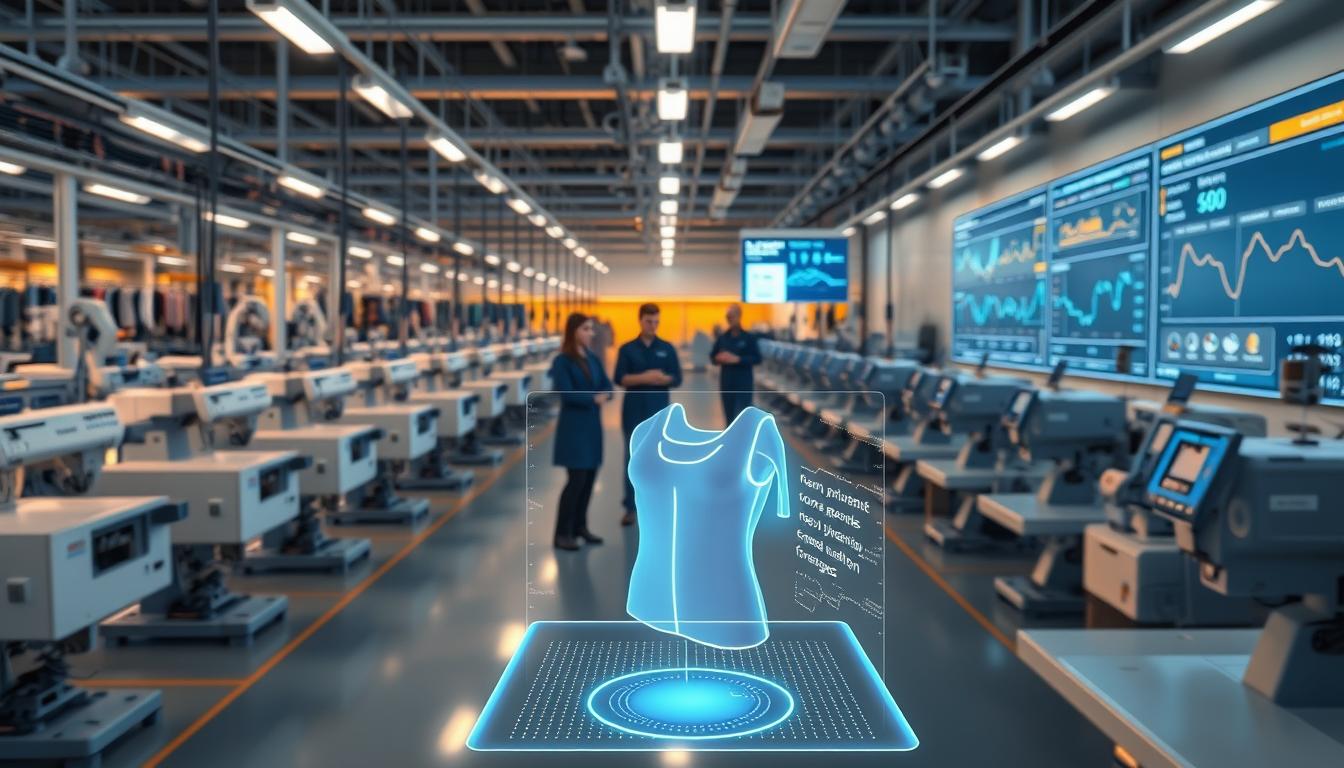
AI Use Case – Demand-Driven Apparel Manufacturing Optimization
Brands that connect real‑time signals to the shop floor move from reactive fixes to proactive production.
From forecast to factory: closing the loop between demand signals and production
Define the scope: unify forecasting, inventory planning, sourcing, production scheduling, and allocation so market demand drives factory priorities in near real time. This alignment reduces lead time and improves execution across processes.
Closing the loop means demand shifts adjust material commitments, cutting plans, sewing lines, and store/DC allocation. Brands like Zara adapt assortments fast; Levi’s cuts fabric waste by up to 15% with smarter cutting; Hugo Boss applies vision systems for consistent quality.
Core benefits: lower overstock, faster turns, reduced waste, higher margins
Benefits map directly to the P&L: lower overstock and fewer markdowns, faster inventory turns, and reduced material and rework costs. These improvements raise full‑price sell‑through and strengthen margins.
- Enablement: data pipelines, forecasting engines, planning software that issues POs, and shop‑floor control systems.
- Management: align merchandising, planning, and production KPIs with a shared cadence and governance playbook.
- Risk: scenario planning, SKU/size/color safety stock rules, capacity modeling, and lead‑time buffers for vendors.
| Metric | Baseline | Target (12 months) | Impact |
|---|---|---|---|
| Overstock rate | 18% | 10% | Lower markdowns, improved cash flow |
| Turn velocity (months) | 6 | 4 | Faster replenishment, reduced working capital |
| First‑pass yield | 92% | 97% | Less rework, lower cost per unit |
| Cost per unit | $12.50 | $11.00 | Higher margin, better pricing flexibility |
Measurement anchors decisions: track overstock rate, stockout rate, turn velocity, first‑pass yield, and cost per unit to quantify the business gains. Practical pilots, clear KPIs, and aligned governance make that shift sustainable.
For a deeper look at supply chain efficiency and real deployments, review this supply chain efficiency study.
Demand forecasting that actually drives production plans
A forecast that hears the market lets brands translate buzz into precise SKU decisions. Forecasting must pull many signals together so production acts on current demand instead of old assumptions.
Data sources: historical sales, social, search, and real‑time signals
Top forecasting tools blend POS and eCommerce history with campaign calendars, Google search trends, social image and video, store traffic, weather, and local events. Each input lifts signal-to-noise and sharpens short windows of demand.
Short‑term vs. seasonal: aligning buys with spikes and cycles
Near-term forecasting catches viral spikes and guides rapid replenishment or micro‑drops. Seasonal forecasting sets buys, vendor capacity, and color/material commitments months ahead.
Case in point: Heuritech’s image analytics for trend prediction
Heuritech analyzes over 3 million social images daily and detects 2,000+ attributes—prints, colors, fabrics, and product details—to quantify trends. That image-led insight helps brands time drops and set depth by region so more launches sell through at full price.
Forecasts must translate into action: size curves, color ratios, and SKU-level purchase orders aligned to capacity and margin targets. Post-launch feedback updates the model; misses reduce future exposure while winning signals scale with confidence.
- Segmentation: build forecasts by region, channel, and persona to reveal local opportunity.
- Human-in-the-loop: blend statistical models with merchant judgment to respect brand DNA.
- Operational tie-in: map forecasts to POs, capacity, and inventory rules so production follows demand.
Apparel inventory management with AI to prevent stockouts and overstock
Keeping the right stock, in the right place, at the right time is a strategic advantage. Effective inventory management reduces lost sales and clears excess cash tied to slow-moving inventory. This section shows practical rules, Shopify-native planning, and team workflows that make that possible.
Dynamic replenishment and safety stock by SKU, size, and color
Dynamic rules set safety stock at the SKU-size-color level, not by category alone. Reorder points tune to sales variability and supplier lead time so stock levels follow actual behavior.
Automated POs maintain availability while reducing excess. Scenario simulations reveal how buffer policies trade cash for service, helping teams balance turns and availability.
Shopify-native planning tools: Prediko’s forecasting and PO nudges
Prediko integrates natively with Shopify to pull sales history, seasonality, campaign effects, and real-time signals. That integration generates precise forecasting and variant-level “Buy Now” nudges to prevent stockouts and improve replenishment timing.
Early adopters report measurable gains: Kate Hewko improved inventory efficiency by 40%, and Kimai saves about 10 hours per week through automatic data sync and order management. These wins show how software and tools free planners to focus on strategy.
- Operational tie-in: planners get buy tables and nudges so popular variants reorder at the right moment.
- Governance: clean naming, disciplined variant attributes, and catalog standards boost forecast accuracy.
- Risk mitigation: simulate supplier delays and demand spikes; surface buffer policies to finance and merchandising.
- Business alignment: set service-level targets and align buys to top-down revenue goals.
Outcome: brands and businesses gain better inventory visibility, tighter levels, and fewer stock surprises—turning demand forecasting inventory into measurable results.
Supply chain optimization across the fashion value chain
When logistics predict demand, brands can compress lead times and protect margin. Visibility across raw materials, mills, cut-and-sew, finishing, distribution centers (DCs), and stores turns uncertainty into prioritized action.
Lead-time compression and bottleneck prediction
Forecast signals that lock material buys early reduce late hits and speed production. Prioritizing purchase orders and shop-floor schedules shrinks cycle time and lowers risk.
Predictive alerts spot capacity hotspots by vendor, line, or port. Teams can reslot production or reroute logistics before service levels fall.
Store and DC allocation tuned to local demand
Allocation should follow local market curves, not averages. Sending the right depth to each store and DC cuts transfers and late markdowns.
Simulations pair inventory targets with local sales patterns, improving availability and turns while saving working capital.
Fast-fashion agility: lessons from Zara’s chain
Zara combines rapid refreshes with small initial buys and fast replenishment. That sequence keeps assortments aligned to live demand and limits overstock.
Brands that map the end-to-end chain and simulate disruptions gain resilience: alternate vendors, buffer routes, and shared KPIs for operations, merchandising, and finance.
- End-to-end mapping: raw material to store with predictive alerts.
- Lead-time focus: prioritize POs and production to capitalize on winning trends.
- Bottleneck detection: reroute or reslot before service levels drop.
- Local allocation: reduce transfers and markdown risk.
| Objective | Baseline | Target (12 months) | Impact |
|---|---|---|---|
| Lead time (days) | 45 | 30 | Faster replenishment, lower stock buffer |
| On-time production | 88% | 96% | Fewer rush orders, reduced premium freight |
| Inter-store transfers | 6% | 2% | Lower markdowns, better local availability |
| Working capital tied up | 7% of sales | 4% of sales | Improved cash flow and margin flexibility |
For deeper reading on supply chain data and analytics, see this supply chain data and analytics guide.
Smart production: cutting, sewing, and lines optimized by AI
Smart production ties shop-floor rhythm to real market signals, trimming delays and cost. Focusing on precise cutting, automated sewing, and predictive line control cuts waste and raises throughput. These changes make the whole process more reliable and repeatable.

Precision cutting that reduces material waste
AI-powered nesting optimizes lay plans to minimize offcuts. That process lowers material cost and environmental waste at the same time.
Levi’s reports up to 15% less material waste after installing smart cutting machines—an immediate improvement to COGS when scaled across lines.
Robot-assisted sewing and vision systems on the floor
Robot-assisted sewing—such as Sewbo’s approach—lets standard robots handle flexible textiles by temporarily stiffening fabrics. The result: fewer bottlenecks, steadier stitch quality, and lower labor intensity.
Vision systems inspect seams and color in-line, catching defects at the source and stopping rework downstream.
Digital twins and predictive maintenance to lift uptime
Digital twins simulate line balance, changeovers, and labor assignments before physical change. Teams can test a new product mix and adjust takt time virtually, reducing trial-and-error on the floor.
Predictive maintenance uses sensor and vision data to flag anomalies early. The outcome is less unplanned downtime and smoother supply flow.
| Capability | Baseline | Target (12 months) | Business impact |
|---|---|---|---|
| Material waste | 18% | 10% | Lower cost per product, smaller environmental footprint |
| Line uptime | 88% | 96% | Higher throughput and on-time delivery |
| Defect rate | 8% | 3% | Less rework and faster time to market |
| Changeover time | 120 mins | 60 mins | Better responsiveness to trend-driven demand |
Quality control automation that scales with velocity
Modern vision systems turn every garment into a measurable data point for faster learning. High-resolution cameras and deep learning models analyze stitching density, color consistency, and seam alignment with sub‑millimeter precision.
Vision systems to catch defects in stitching, color, and seams
Throughput keeps pace with drops: inspection runs inline at production speed so quality thresholds do not slow launches.
Automated tagging generates control charts and granular Pareto views by supplier, machine, and shift. That data drives targeted process fixes and fewer repeat defects.
Consistent standards at speed
Hugo Boss scans each product for microscopic defects, color mismatches, and seam misalignments, raising consistency across batches.
“Objective inspection reduces returns and protects brand trust by catching issues before packaging.”
Defect data feeds MES and PLM systems, creating ECRs and vendor scorecards that align incentives for continuous improvement.
| Metric | Baseline | Target (12 months) |
|---|---|---|
| Defect detection rate | 85% | 98% |
| Rework hours per 1,000 units | 18 | 6 |
| Customer returns | 3.5% | 1.2% |
Governance: periodic model retraining keeps detection current with new fabrics, dyes, and construction techniques. Early detection cuts scrap and rework, improving labor efficiency and margin.
For implementation guidance on related product features and processes, see this 3D garment design automation resource.
Retail execution: omnichannel signals feeding the forecast
Shelf-level visibility and checkout telemetry shift forecasting from hindsight to immediate action. Real-time store signals turn everyday customer behavior into high-fidelity demand inputs. That change lets planners treat stores as active sensors, not just sales endpoints.
Computer vision for real-time stock and shelf accuracy
Computer vision monitors facing counts and gaps, flagging phantom stock and prompting replenishment tasks. Cameras read shelf layouts, detect empty facings, and create task lists for store teams.
Those signals cut write-offs: vision reconciles physical stock with POS and backroom inventory, reducing shrink and improving gross margin accuracy.
Checkout and traffic data as demand inputs
Amazon Go’s Just Walk Out approach—tracking picks and put‑backs with cameras and sensors—turns each in‑store action into an itemized event. Item-level pick/put-back events and footfall become immediate demand signals, not lagging proxies.
When these events feed forecasting systems, buy plans and DC allocations update within hours. Unifying BOPIS, ship‑from‑store, and returns data reveals true availability and regional velocity patterns.
- Labor planning: footfall patterns shape schedules, reducing queues and lost sales.
- Operational tightness: in-store signals trigger DC resupply and micro‑drops for hot SKUs.
- Customer experience: faster shelf recovery and accurate stock raise conversion and loyalty.
Personalization and style insights that shape demand
When recommendations fit, customers buy more—and planners see cleaner demand signals.
Virtual try-ons and smart mirrors give customers confidence in fit and color. Warby Parker’s virtual try-on demonstrates how fit guidance reduces returns and raises conversion. Ralph Lauren’s Ask Ralph shows that personalized, shoppable looks lift basket size and attachment rates.
Stylists and recommendation tools nudge buyers toward repeatable styles. That stabilizes demand curves and improves forecasting accuracy for product planners.
Marketing, assortment, and persona-driven tuning
Segment by persona and micro‑trend to match creative and inventory to what each tribe prefers. Dynamic campaigns can favor SKUs with capacity and pause spend on items at risk of stockout.
- Connect personalization to demand: recommendation engines increase conversion and create predictable follow-on sales.
- Close the loop: feed live sentiment and sell-through into merchandising and forecasting dashboards.
- Advance CRM: propensity models time offers so customer lifetime value rises and volatility falls.
Result: brands gain clearer insights, higher conversion, and a demand signal that helps retail, planning, and design act in concert.
Sustainability gains from demand‑aligned production
When output matches likely sales, material and carbon footprints fall fast. Producing closer to what will sell reduces unsold inventory, markdowns, and the reverse logistics that add miles and waste.
Less overproduction, fewer markdowns, and lower returns
Tighter alignment lowers fabric scrap and cut rework through precision cutting and right‑first‑time quality checks. That translates into measurable reductions in waste and cost per unit.
Result: fewer returns mean fewer miles driven and less repackaging waste. Better fit guidance and personalization shrink return rates and save energy across the supply chain.
Energy optimization in factories and logistics
Patagonia monitors equipment loads and shifts usage to off‑peak hours, reducing consumption and carbon footprint while improving operational efficiency.
Brands should track intensity metrics—kg waste per unit, kWh per unit, and return rate—so sustainability gains are auditable and tied to business goals.
- Produce closer to demand to cut unsold inventory and markdowns.
- Use precision systems to lower material waste and rework energy.
- Evaluate materials for impact and compliance to meet sourcing goals.
| Metric | Baseline | Target (12 months) |
|---|---|---|
| kg waste per unit | 0.8 | 0.4 |
| kWh per unit | 2.5 | 1.8 |
| return rate | 8% | 4% |
Operational realities: data integration, returns, and multichannel
Returns and fragmented sales channels distort planning unless systems talk to each other. Fashion and retail businesses face high return rates that can flip availability and bias forecasts.
Practical operations start with transparency: when a return hits a DC, the planner must see it by SKU, size, and location. That update should flow into live demand forecasting so teams avoid false shortages or overbuys.
Unify warehouses, stores, and marketplaces
Merge data from warehouses, stores, D2C, and marketplaces into one planning view. Standardize catalog attributes, EDI/API links, and reconciliation rules so businesses stop double-counting stock.
- Tackle returns head-on: adjust inventory availability and forecasts in near real time.
- Governance: role-based management and audit trails keep planning accountable.
- Model constraints: vendor MOQs, transit times, and receiving capacity must shape recommendations.
| Metric | Baseline | Target (12 mo) | Impact |
|---|---|---|---|
| Returns lag in forecast (hrs) | 48 | 6 | Fewer false stockouts |
| Unified coverage (%) | 65% | 95% | Reduced blind spots |
| PO automation rate | 30% | 75% | Faster replenishment |
| Forecast refresh cadence | weekly | daily/intraday | Better service levels |
Tool enablement matters: Shopify-native apps like Prediko consolidate multichannel data, automate buys, and give planners a single surface to manage inventory and forecasting. That lets businesses spend time on decisions, not data wrangling.
Conclusion
Closing the loop between trend signals and the shop floor creates measurable business advantage.
Connect forecasting to inventory management, supply chain orchestration, and smart production so plans become on‑time, on‑cost output. Leaders such as Zara, Levi’s, Hugo Boss, and Patagonia show this drives lower overstock, faster turns, and higher service level.
Roles matter: merchandising, planning, sourcing, manufacturing, and logistics share unified KPIs tied to business goals. Start pragmatic—pilot a region or category, measure results, then scale integrations and models.
Short feedback loops from retail signals to floor schedules become a core capability that compounds learning each season. For technical reference on smart shop‑floor systems see smart manufacturing, and for demand insights tied to personalization see personalized recommendations.
FAQ
What is demand‑driven apparel manufacturing optimization?
It is a strategic approach that aligns production and inventory with real customer demand. By linking forecasting, replenishment, and shop floor planning, brands reduce overstock, speed up turns, cut waste, and protect margins.
Why do demand‑driven operations matter now?
Consumer expectations and fast-fashion cycles squeeze lead times and inventory accuracy. Demand‑aligned processes let businesses respond to trends faster, avoid markdowns, and improve profitability amid volatile buying patterns.
What types of demand signals feed the forecast?
Effective systems combine historical sales with social listening, search trends, real‑time POS and checkout data, web traffic, and store sensors. Blending short‑term spikes with seasonal patterns sharpens buying and production plans.
How does better forecasting change production planning?
Forecasts that drive production close the loop between merchants and factories. They inform order timing, lot sizes, and cut plans so factories run leaner and deliveries match market windows—reducing lead‑time risk.
What are the core benefits for inventory management?
Brands see fewer stockouts and less excess inventory by using dynamic replenishment and SKU‑level safety stock. Faster replenishment, precise allocations by size and color, and automated PO guidance cut carrying costs.
Can this approach reduce waste and support sustainability?
Yes. Producing to demand lowers overproduction and markdowns, reducing returns and landfill waste. It also enables energy and material efficiencies on the shop floor and in logistics.
What software tools support these capabilities?
Tools include forecasting and planning suites that integrate POS, e‑commerce, and marketplace data; image analytics for trend prediction; and execution platforms for PO nudges and replenishment. Native commerce integrations often accelerate time to value.
How do brands handle returns and exchanges in live forecasts?
Modern forecasts bake returns into demand models by using historical return rates, reverse logistics timing, and real‑time returns feeds. That prevents inflated replenishment and keeps safety stock calibrated.
What operational changes are required to implement demand‑alignment?
Teams must unify data across warehouses, stores, and channels; define SKU hierarchies and replenishment rules; and create feedback loops between merchandising and production. Cross‑functional governance speeds adoption.
Are there industry examples of success?
Several brands and vendors have demonstrated gains: image‑based trend prediction has shortened design cycles, precision cutting reduced material waste, and store allocation tuning improved local sell‑through—each delivering measurable margin and inventory benefits.
How does lead‑time compression improve responsiveness?
Shorter lead times lower the risk of forecasting error and let brands place smaller, more frequent orders. Predictive bottleneck alerts and supplier collaboration also reduce delays, enabling faster replenishment.
What role does on‑floor automation play?
Automation—robotic sewing, vision quality checks, and digital twins—raises throughput and consistency. These technologies cut defects, increase uptime, and allow flexible lines that respond to changing mixes.
How are omnichannel signals used for retail execution?
Omnichannel data—store traffic, checkout flows, and shelf‑level vision—feeds the forecast to refine allocation and promotions. Real‑time visibility ensures inventory follows demand across channels.
How do personalization and style insights shape assortments?
Personalization tools and virtual try‑ons reveal micro‑trends and customer preferences. Brands leverage that insight to tune assortments, marketing, and production toward higher‑conversion items.
What metrics should teams track to measure success?
Focus on sell‑through rate, inventory turns, gross margin return on inventory, stockout frequency, and waste reductions. Improvements in lead time and forecast accuracy also indicate operational health.
How do companies ensure data quality across systems?
They standardize SKUs, implement master data governance, set clear update cadences, and use middleware or native integrations to sync POS, warehouse, and marketplace feeds. Regular audits maintain reliability.